
Systemic racism has contributed to the persistence of race-based gaps that manifest in many different economic indicators. The starkest divides are in measures of household wealth, reflecting centuries of white privilege that have made it particularly difficult for people of color to achieve economic security. This series of charts begins with a look at how the pandemic has exacerbated racial inequalities.
The Racial Wealth Divide
Racial Income Inequality
Race and Gender Inequality
Racial Inequality and Covid-19
Racial Wealth Divide
By the middle of the 21st century, the United States will be a “majority minority” nation. If we hope to ensure a strong middle class, historically the backbone of the national economy, then improving the financial health of households of color will become even more urgent than it is today. Closing the persistent “wealth divide” between white households and households of color, already a matter of social justice, must become a priority for broader economic policy.
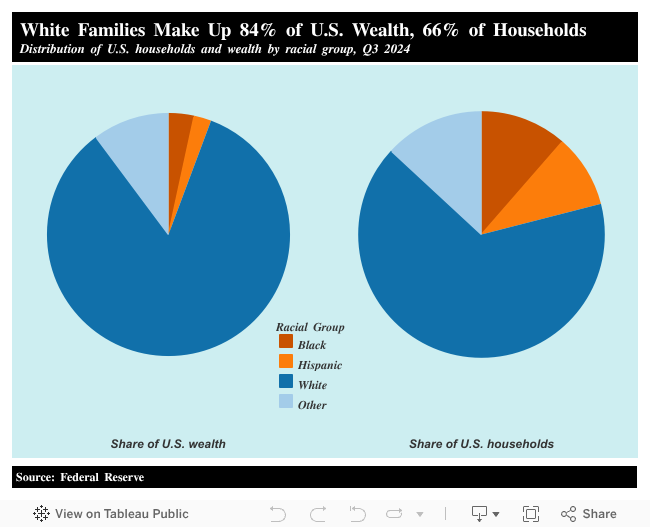
Public policies that favor white Americans and the wealthy have perpetuated both an extreme concentration of wealth and an extreme racial wealth divide. White households, Federal Reserve data show, held 84.2 percent of all U.S. wealth as of the fourth quarter of 2023, while making up only 66 percent of households. By contrast, Black families accounted for 11.4 percent of households and owned 3.4 percent of total family wealth, while Hispanic families represented 9.6 percent of households and owned 2.3 percent of total family wealth. These wealth figures include the value of consumer durable goods, such as vehicles.
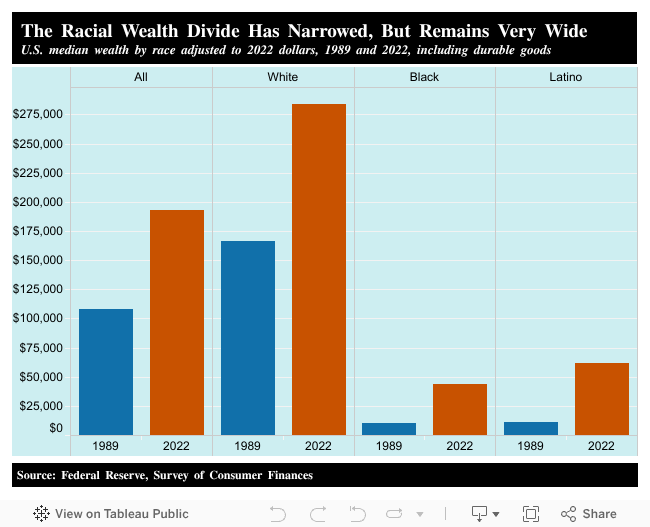
The racial wealth divide, according to Survey of Consumer Finances data, has narrowed slightly since 1989, but remains extremely wide. The median Black family has a net worth (including cars and other durable goods) of $44,100, just 15.5 percent of the $282,310 median white wealth. The typical Latino family, with $62,120, owns just 21.8 percent of the wealth of the median white family. The Institute for Policy Studies report, Ten Solutions to Bridge the Racial Wealth Divide, offers proposals for bold, structural reforms to address this problem.
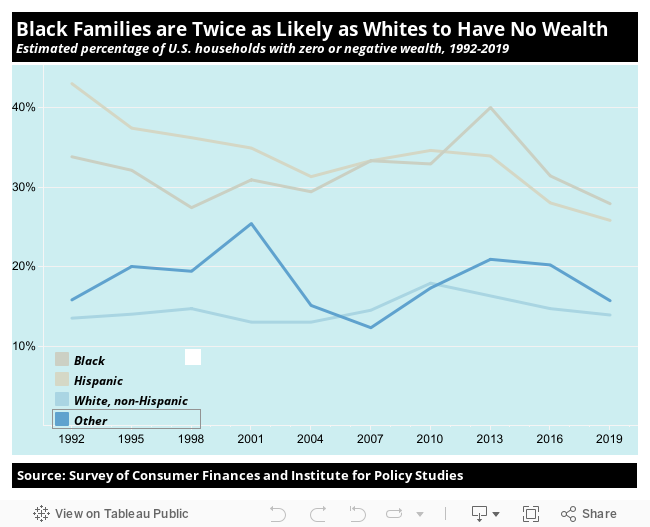
Families that have zero or even “negative” wealth (meaning the value of their debts exceeds the value of their assets) live on the edge, just one minor economic setback away from tragedy. Institute for Policy Studies analysis of Federal Reserve data show that while the racial wealth gap has improved slightly, an estimated 28 percent of Black households and 26 percent of Latino households had zero or negative wealth in 2019, twice the level of whites.
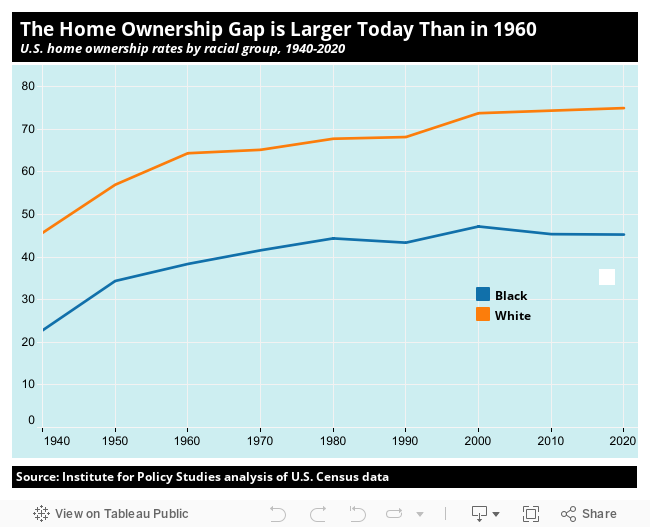
As with total wealth, home ownership is heavily skewed towards white families, our 2023 report with the National Community Reinvestment, Still a Dream, shows. Between 1960 and 2020, the rate of Black home ownership increased but the gap in ownership rates between Black and white families widened, from 26 percentage points to 30. Structural barriers, including lower incomes, higher rates of mortgage denials, and racial segregation, deny many Black families the opportunity to acquire this wealth-building asset.

Black people also have to deal with larger student debt burdens. Black students on average have to take out larger loans to get through college than their white peers. A National Center for Education Statistics study reveals that Black Bachelor’s degree and Associate’s degree graduates face 11 percent and 20 percent more student debt, respectively, than their white peers. The challenge of paying off greater student debt is also worsened for Black graduates due to their lower average incomes. Black Bachelor’s degree and Associate’s degree holders earn 20 percent and 8 percent lower incomes, respectively, than whites with the same degree.
Racial Income Inequality

In 2024, Fortune 500 CEOs, who earned $18.9 million on average, included just eight Black people — less than 2 percent of the total. By contrast, Black Americans made up 19 percent of the U.S. workers who would directly benefit from a raise in the federal minimum wage to $17 per hour by 2030, according to Institute for Policy Studies analysis of Economic Policy Institute data. Black people comprise 13 percent of the entire U.S. labor force.
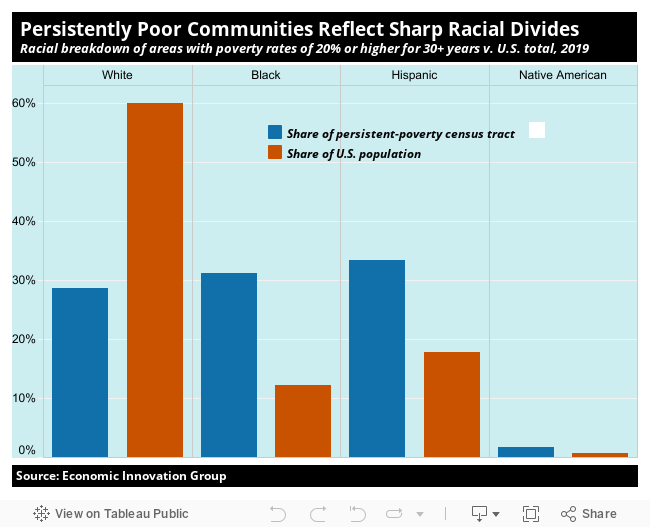
The world’s wealthiest country is home to numerous communities that have been poor for generations: think parts of Appalachia, the Mississippi Delta, the southern border, and Chicago’s South Side. An Economic Innovation Group report finds that people of color are far more likely to live in “persistently poor” communities – defined as those with poverty rates of 20 percent or higher for at least 30 years – than white Americans.

Racial discrimination in many forms, including in education, hiring, and pay practices, contributes to persistent earnings gaps. As of the second quarter of 2025, the median white worker made 24 percent more than the typical Black worker and around 29 percent more than the median Latino worker, according to BLS data.

The federal government has long served as a key source of stable, middle class jobs for Black workers. This is threatened under the Trump administration’s assault on federal employees. Economic Policy Institute research shows that Black workers make up a disproportionate share of all federal workers and a particularly large share at agencies targeted for mass layoffs. At the Department for Veterans Affairs, for example, Black workers represent more than a quarter of employees. That agency is expected to face 80,000 job cuts.
Race and Gender Inequality

Within racial groups, Bureau of Labor Statistics data show the largest pay gaps between men and women appear among whites and Asians — not because Latinas and Black women have made faster progress towards equity but because average pay for men in these groups falls far below the compensation of white and Asian men. Hispanic/Latina women are the lowest-paid of any group, making just 50 cents for every dollar an Asian male earns and 65 cents for every dollar a white male earns.

While student loan burdens have grown significantly for all racial groups, they are particularly heavy for Black students — especially women. According to Center for Economic and Policy Research analysis of Americans who have attended college, 43.3 percent of Black women are shouldering student loan debts, compared to just 15.7 percent of white men.

Racial inequality in terms of the official poverty rate is also particularly acute for women of color. As National Women’s Law Center research shows, while in 2023 the U.S. poverty rate for white men is 6.8 percent, it is 17 percent for Black women, 16 percent for the Latina community, and 20 percent for Native American women.
Racial Inequality and Covid-19
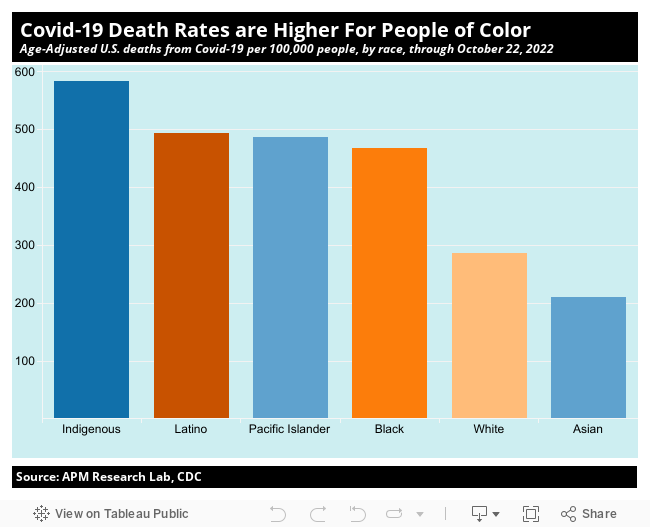
According to APM Research Lab, white and Asian Americans have substantially lower Covid-19 mortality rates than those of other racial and ethnic groups. Between the start of the pandemic and October 2, 2022, indigenous people suffered 582 deaths per 100,000 people – more than twice the death rate for whites and Asians.
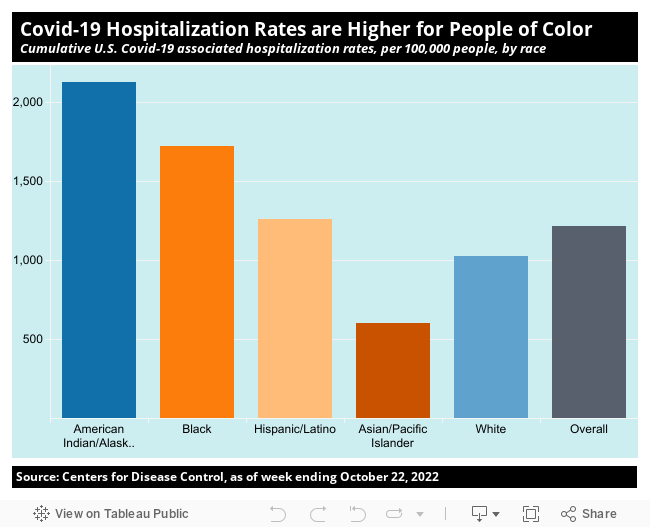
People of color are more likely to suffer severe illness from Covid-19, regardless of their age. According to CDC data, hospitalization rates have been highest among indigenous and Black Americans. About 2,100 indigenous and 1,700 Black Americans were hospitalized for Covid-related symptoms per 100,000 people in their respective ethnic and race groups between the beginning of the pandemic and October 22, 2022.
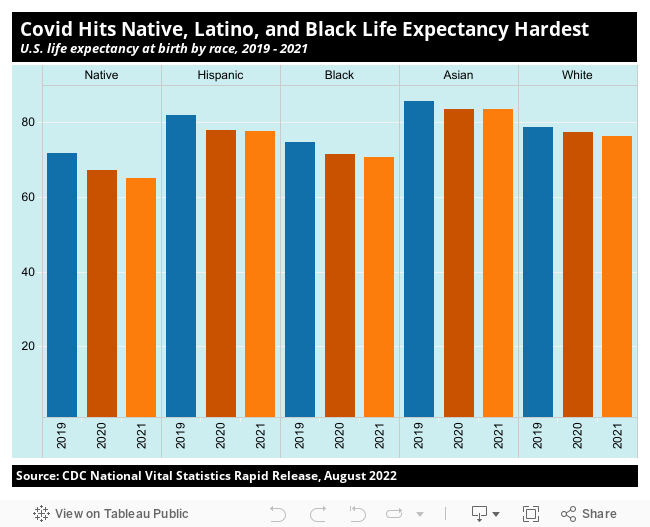
The racial disparities in Covid-related health indicators have contributed to a steeper decline in the U.S. life expectancy for people of color, according to data from the National Center for Health Statistics and the CDC. Between 2019 and 2021, American Indians and Alaska natives experienced the biggest drop, with life expectancy at birth plunging by more than 6 years to 65.2. The Latino and Black communities both experienced a drop of four years, while Asian and white Americans have seen a decrease of about two years since the start of the pandemic.

The pandemic-related economic crisis in 2020 was particularly devastating for people of color. When the shutdown sent unemployment levels skyrocketing in March and April of that year, Black and Latino workers were much more likely to be jobless than white workers, according to BLS data. This remained true despite the fact that people of color made up a disproportionate share of essential workers who had to remain on the job at the start of the pandemic. While the overall unemployment rate has dropped significantly, racial disparities remain. In July 2025, Black unemployment stood at 7.2 percent, compared to 3.7 percent for white workers, according to BLS data.
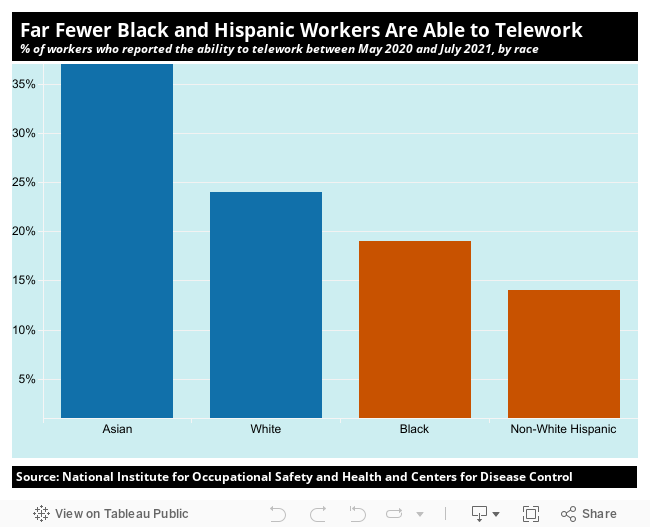
The Covid-19 pandemic has increased the share of U.S. workers who are teleworking for health reasons, but not everyone has the same ability to work from home. According to the Centers for Disease Control and the National Institute for Occupational Safety (NIOSH) and Health, Black and Non-white Hispanic workers are less likely to report being able to telework than white and Asian workers. Some 38 percent of Asian workers and 24 percent of white workers reported working from home between May 2020 and July 2021. By contrast, only 19 percent of Black and 14 percent and Non-white Hispanic workers reported working from home in that same time period. The researchers attributed 80 percent of this divide to racial education gaps, since college graduates are more likely to be able to telework. Workers of color with public-facing jobs have been exposed to greater virus risks.